How to backtest a trading idea without fooling yourself
Short answer: assume the backtest is lying until it passes seven checks. Almost every mistake in a backtest makes the result look better, and none of them shows up as an error. A strategy that is quietly overfit looks exactly like a good one. These are the checks we run on every idea on this site, with the cases where they caught us.
The trap in one chart
We made 200 trading rules that are pure coin flips: each "trade" wins with probability exactly 50%, no edge at all. We gave each rule 500 trades on a first stretch of data and picked the ten that did best. Then we let the same ten rules trade 500 more times on data they had not seen.
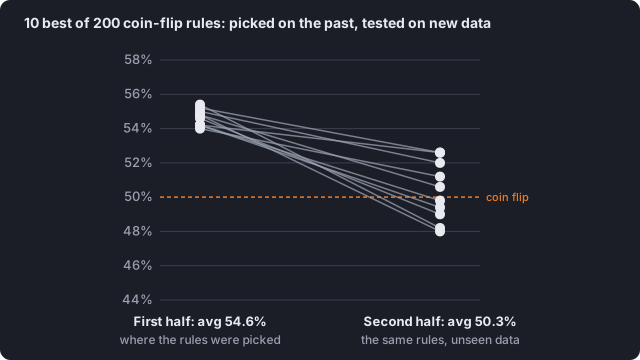
On the first half, the best ten won 54.6% of the time on average, the top one 55.4%. Over 500 trades, that looks like a real edge. On the second half they won 50.3%, a coin flip, because that is what they always were. Of the 200 rules, 22 cleared 53% on the first half by luck alone.
Nobody tests 200 rules on purpose. But trying a few indicators, a few settings for each, a few pairs and a few timeframes gets you there quickly, and the best combination is what gets posted on social media. Each check below catches a different version of this trap.
1. Compare against the right baseline, which is rarely 50%
"Wins 53% of the time" means nothing until you know what doing nothing clever would score.
- Drift is the market's overall direction over the period. In a market that drifted up, any "buy" signal wins more often. EUR/USD fell over 2010–2026, so any rule that mostly sells looks good on that history.
- Some hours of the day lean one way. A pattern that fires at such an hour inherits that lean.
Our case: in one study, three of the four setups we tested passed our threshold for a pass. Then we checked each one against simply always betting the same way in that session: the hit rates were identical (53.3% vs 53.3%). The "signal" was the drift. Since then, every study measures the edge against the same market, the same period and the same time of day, never against 50%.
2. Rank by the worst plausible case, not the win rate
A rule that won 6 trades out of 6 has a 100% win rate. A rule that won 232 of 400 has 58%. The first one tells you almost nothing.
We use a confidence bound: the lowest win rate that is still consistent with the results (the Wilson lower bound, at 95%). For 6/6 it is 61%; for 232/400 it is 53%. That is the honest comparison, and it already pulls the 6/6 result down a lot.
It does not pull it down enough. Even with the bound, 6/6 still ranks above 232/400. So we also set a minimum number of trades and throw out anything below it, rather than just ranking it lower. A handful of perfect trades is the most common way to find a "95% win rate strategy".
3. Keep data the idea has never seen
Split the history before you start: fit and choose on the first part (in-sample), then run the finished rule once on the second part (out-of-sample, also called the holdout). Change nothing in between. Our default split is 2010–2018 to choose, 2019–2026 to test.
The chart above is this check in action. It also works on real ideas:
- Month-end currency flows (a known academic effect): +0.078% a trade in 2010–2020, statistically strong. Since 2021: −0.015% a trade, and the sign flipped for EUR and GBP. The effect was real; it is gone.
- Betting against a strong two-hour move: lost money in-sample, out-of-sample, on all 7 pairs and in 17 of 17 years. A holdout also saves you from tuning a dead idea forever.
One rule matters more than the split itself: if you look at the holdout, change the rule and look again, it is not a holdout any more. It has become more in-sample data. Run it once.
4. Count every try
The 200 rules in the chart are the whole point: the more things you try, the better the best one looks by luck. So we write down, before looking at results, how many variants we will test and what counts as a pass, and we report the number of tries next to the winner.
Our case: in our AI news-forecast experiment, the European session hit 57% and the US session 48%. It is tempting to say "trade the mornings". But that was one of six ways we split the results, and with 54 forecasts per session a gap that size shows up by chance about one time in three.
Watch out for samples that look larger than they are. Three currency pairs that share a currency (EUR/USD, USD/CHF, EUR/CHF) move together, so 423 "events" across the three were really about 141 independent days. Six correlated stocks on the same 234 dates are not 1,400 data points.
5. Pay the real costs
A rule that is right more than half the time can still lose money. With a typical retail spread of about 1.5 pips (a pip is 0.0001 for most currency pairs) and a move of about 14 pips per trade, you need to be right roughly 55% of the time just to break even, if wins and losses are about the same size.
- Use the spread your broker actually charges, at the hour you would trade. Late evening (around 21:00–23:00 UTC, the daily rollover) spreads are several times wider, and that is exactly where many "edges" live. Our best "bet against a strong move" setup sat there: positive only if you assume normal spreads.
- Holding overnight costs swap (the overnight interest your broker charges). A carry trade (holding a high-interest currency against a low-interest one to earn the difference) can look fine on prices alone and much worse after the broker's swap markup.
- Count every trade, including the boring ones you would "obviously" have skipped.
6. Use only what you could have known at the time
Look-ahead bias is using information in the backtest that did not exist yet when the trade would have been placed. It is easy to do by accident:
- Trading at today's close on a signal that needs today's close: you only know the close after the market has closed.
- Using a data series that gets revised (economic data, index membership lists) at its final value instead of the first one published.
- Using the stocks that exist today. Our meme-stock study had to include companies that later went bankrupt and were delisted; without them, buying crashed penny stocks looks far better than it is. We counted a delisted position as a total loss in one column and at its last price in another, since the truth is somewhere between.
The fix is mechanical: for every input, write down the exact moment it becomes known, and open the trade strictly after that.
7. Check it is stable over time
An effect that only exists in one stretch of history is a story about that stretch. Split the results by year or by half and look:
- Betting against the first move after a news release: 63% in 2019–2026, but 49% in 2011–2018, below its own baseline. The whole "edge" came from one half.
- Gold had a Sharpe ratio (return per unit of risk) of 0.38 over 2010–2026, but slightly negative in 2010–2018. It worked in one market period, not as a lasting rule.
Our threshold for a pass requires the effect to beat its baseline in each half of the history separately, not just on the total.
Our checklist
Before believing any backtest, including ours:
- Is the edge measured against the same market's own drift, not 50%?
- Is it ranked by a confidence bound, with a minimum number of trades?
- Was it tested once on data it was not chosen on?
- How many variants were tried, and was the threshold for a pass written down first?
- Does it survive the real spread at the real hour, plus swap?
- Was every input known before the trade?
- Does it hold in each half of the history?
Every study on this site is pre-registered with these checks: the question, the data split, the costs and the threshold for a pass are written down before the first result is scored. Most ideas fail one of them, and we publish those too.
What this guide cannot do
Passing all seven checks does not make a rule profitable in the future. It only means the result is not obviously an artefact. The last test is the one nobody can fake: write down your calls before the market moves and count them afterwards. That is why we run a live forward test.
Live data · updated every evening
See a forecast tested this way, in real time. Every call written down before the session opened, then scored against what the price did, hits and misses alike.
Educational content, not financial advice.