The month-end dollar trade: real for a decade, unreliable since 2021
Picture a pension fund in Amsterdam that owns a large pile of American shares. Its members will be paid in euros, so the fund doesn't want a weaker dollar to eat into their pensions. Once a month, on the last working day, at four o'clock in the afternoon London time, someone at the fund does a bit of currency housekeeping. Many funds in Europe, Japan and elsewhere do the same thing, at the same minute. That is a lot of money moving one way at a time everyone knows in advance.
Two researchers, Melvin and Prins, wrote this up in 2015 and showed that the housekeeping really did push the dollar around. It is one of the rare trading ideas with a boring, believable reason behind it. So we tested it on 16 years of prices, 192 month-ends in all. The answer turned out to depend very much on which years you look at.
The housekeeping, step by step
A hedge is a trade that cancels out a risk you don't want. Our Amsterdam fund owns, say, $100 million of US shares. If the dollar falls 5% against the euro, those shares are worth 5% fewer euros, even if the shares themselves did nothing. So the fund also sells $100 million for euros at a future date (a forward). Now a weaker dollar hurts the shares but helps the hedge, and the two roughly cancel.
The catch: share prices move and the hedge doesn't follow on its own. If US shares rise 5% during the month, the fund owns $105 million of shares but is hedged on only $100 million. So at the month-end it sells another $5 million of dollars to catch up. If shares had fallen, it would buy dollars back.
Most funds do this at the London 4 pm fix: a benchmark exchange rate set from trading around 16:00 London time, which many funds use to value what they own. So:
- US stocks rose during the month → funds sell dollars into the fix → the dollar should weaken that afternoon.
- US stocks fell → they buy dollars → the dollar should firm up.
And you know which way the month went before the last day starts. That is what makes it look tradable.
Why this one deserved a fair hearing
Most ideas we test on this site come from chart patterns or forum folklore. This one is different.
- There is a known buyer or seller. The flow comes from a rule real funds follow, not from a theory about crowd psychology, and anyone can work out its direction from a stock index.
- It was published with evidence. The 2015 paper found the effect in actual exchange rates.
The flip side: an idea this easy to understand is also easy for big banks to trade before you do. Keep that thought for later.
How we tested it
- The dollar, measured fairly. Instead of one pair, we used a dollar index: the average move of the dollar against seven major currencies (euro, pound, yen, Swiss franc, and the Australian, Canadian and New Zealand dollars). "Betting against the dollar" means doing it on all seven at once, in equal amounts.
- The direction of the bet. We took the change in the NASDAQ Composite, a broad index of US shares with a heavy tilt to tech, from the end of the previous month to the US close the evening before the last working day. That is known before European trading opens on the last day. If it was up, we bet against the dollar; if down, on it.
- Four time windows on the last day: the morning (07:00 UTC to the fix), the whole day (from 21:00 UTC the evening before to the fix), the last three days up to the fix, and, as a check, the day after the fix (to the next day's fix), still with the same bet.
- Units. Results are in basis points (bp): 1 bp is 0.01%, so 8 bp on $10,000 is $8.
- Costs. The broker's fee is the spread, the gap between the buying and the selling price. On these seven pairs a round trip costs roughly 1.1 bp, a bit over one pip on EUR/USD.
- Two periods: 2010–2020 and 2021–2026. A real, lasting effect should show up in both.
- Luck or not. For each result we give a score of how far it is from what chance would give: 0 means nothing, about 2 or more is what researchers usually call "significant". (More in our guide to backtesting without fooling yourself.)
2010 to 2020: the paper was right
In the first period the effect is there, in the direction the hedging story predicts, in every window we looked at.
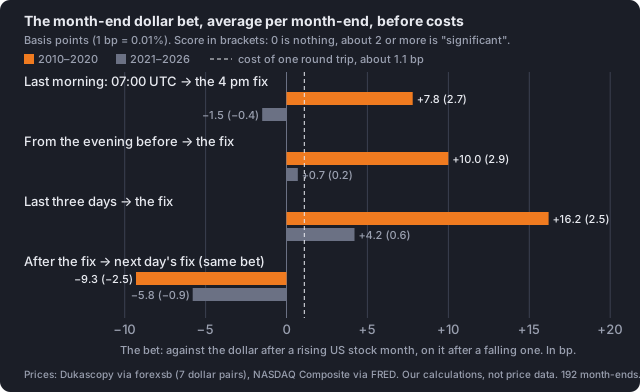
How to read it: each pair of bars is one time window. Orange is 2010–2020, grey is 2021–2026. A bar to the right of zero means the bet made money before costs; the dashed line is what one round trip costs. The number in brackets is the luck score.
- The last morning made +7.8 bp per month-end on average (score 2.7): about +6.7 bp after costs.
- The whole last day made +10.0 bp (score 2.9).
- The last three days made +16.2 bp (score 2.5), though a longer window also catches more of whatever else happened that week.
- It shows up currency by currency, strongest for the pound, the euro and the Swiss franc, with scores between 2.5 and 4.3 for those three on their own.
There is one more clue that the flow was real. After the fix, the dollar tended to bounce back. Keeping the same bet from the fix to the next day's fix lost 9.3 bp on average (score −2.5), so betting on the reversal would have made about +9 bp. That is what a temporary push looks like: a burst of forced selling bends the price, and once it is done, the price drifts back.
One honest discount: the three windows overlap (the morning is part of the day, the day part of the last three days), so they are one finding, not three confirmations.
2021 onwards: the trail goes cold
Then the grey bars. In 2021–2026:
- The last morning: −1.5 bp (score −0.4). Not just smaller, slightly the wrong way.
- The whole last day: +0.7 bp (score 0.2), less than the cost of the trade.
- The last three days: +4.2 bp, but with a score of 0.6, well inside what luck produces.
- The bounce after the fix shrank to 5.8 bp (score −0.9): no longer clearly different from nothing.
- For the euro and the pound, where the effect used to be strongest, the direction flipped.
- Even the plain calendar habit faded. In the earlier years the dollar tended to soften into the month-end fix whatever stocks had done. That softness is gone, and the firming after the fix has roughly halved.
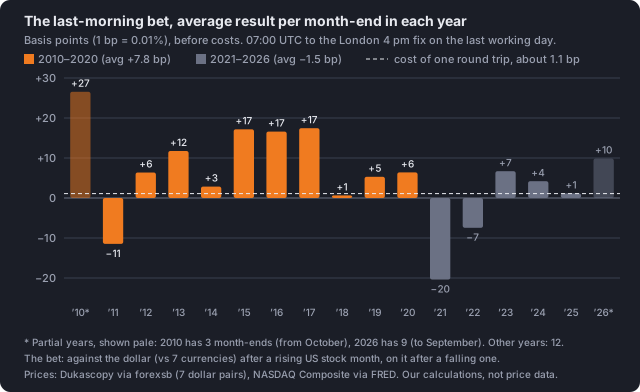
How to read it: one bar per calendar year, in date order, showing the last-morning bet's average result per month-end before costs. 2010 has only three month-ends and 2026 nine, so treat those two bars with care.
The years tell a less tidy story than the averages. Before 2021, ten of eleven years were positive, though 2018 only barely. Since then, 2021 lost badly, 2022 lost too, and the four years after that were small gains. The losing years are big enough to sink the average: over 2021–2026 as a whole, the morning bet lost money.
Notice what happens if you ignore the split and average all 16 years: the morning bet shows +4.5 bp with a score of 1.9, almost "significant". That looks like a weak but live effect. It is really a strong effect averaged with almost six years in which it did not hold. That is why we look at the periods separately.
What it would have paid, and what it pays now
At its best, the effect was worth roughly 8 to 16 bp per month-end before costs, depending on the window: about twelve trades a year, each earning a few hundredths of a percent after the spread. Real, but small. Since 2021, a few basis points with a score that luck explains easily is not worth trading.
Where did it go?
Our study shows that the effect weakened. It can't prove why. The most likely explanation is the flip side from earlier: once a pattern is published and easy to compute, it gets arbitraged away, meaning other traders spot the free money and trade ahead of it until there is none left. Banks now publish their own estimates of month-end rebalancing flows for their clients, and anyone with that estimate can trade before the fix rather than at it. The forced flow still happens, but if the price has already moved before 4 pm, there is nothing left to catch at 4 pm.
The timing isn't neat, though: the paper came out in 2015, and the effect kept working for five more years.
What would bring it back
- The recent years holding up. The morning and whole-day bets made small gains in 2023–2026, after the two bad years. We picked that stretch after seeing the chart, which is exactly how people fool themselves, so it proves nothing yet. It is a reason to re-check with fresh data, not to trade.
- A sharper measure of the flow. We used the NASDAQ as a stand-in for "US stocks". The research uses how US stocks did compared with foreign stocks, which is closer to what really forces funds to rebalance. It would still have to beat the same costs.
- Finer data around the fix. We used hourly prices. The real action is in the minutes around 4 pm, and hourly bars can't show whether someone could actually have traded there.
The fine print
- The split was our choice, not fixed in advance. We did not write down "2010–2020 against 2021–2026" before looking at any numbers, and we did not try other cut-off years. A split chosen that way can make a change look sharper than it is. The year-by-year chart is there so you can judge for yourself.
- NASDAQ as a proxy. The S&P 500 series in our data source (FRED) starts only in 2016, too late for the first period.
- Costs are an average. About 1.1 bp per round trip across the seven pairs. We did not model a wider spread at the fix, when everyone trades at once.
Everything behind this article, including the code and the per-currency and per-year results, is in the study files.
Educational content, not financial advice.