Do rainy weekends in London move EUR/USD? The indicator that passed every test
We tested rainy London weekends on 16 years of EUR/USD, EUR/CHF and USD/CHF, along with 136 other absurd indicators, from moon phases to Nicolas Cage films. Most of them fell apart as soon as they met years that took no part in picking them. One did not: the week after a rainy weekend in London, EUR/USD tends to go up, and it survived every check we could think of. Here is how we found it, how hard we tried to break it, and what it really tells you.
The question
Forex is famously hard to predict. Professional economists with real models struggle to beat a coin flip. So we asked the opposite question: what if you skip the economics entirely and look for anything that lines up with the price? The Moon. The weather in Zurich. Who won the Formula 1 race. How many owls people reported in Switzerland that month.
It sounds like a joke, and it partly is. But this is also, quite literally, how a lot of "secret indicators" are made: try many things, keep the one that fits the past, and sell it.
Why this is less silly than it sounds
- The charts look amazing. Over 2014–2015, the number of films Nicolas Cage released and the EUR/USD rate moved together with a correlation of 0.93. Sunspots and EUR/USD in 2021–2022: −0.91. (A correlation of 1 means two lines move exactly together, −1 exactly opposite, 0 not at all.) Put either on two axes and it looks like a law of nature.
- There is always a story. The Moon moves the oceans, so why not markets? Rainy weekends make London traders gloomy. Swiss owls know something about the franc.
- Nobody counts the failures. If you try 400 things and show one, the one looks like genius.
How we gave each one a fair chance
- 137 indicators in five groups: astronomy (moon phases, supermoons, eclipses, Mercury retrograde, sunspots, geomagnetic storms, zodiac signs), weather (temperature, rain, snow, sun and wind in London, Zurich, Geneva, Frankfurt and New York, plus Punxsutawney Phil), sport (Bundesliga, Premier League, Swiss league, Champions League, Super Bowl, F1 winners, Federer and Djokovic), pop culture (Wikipedia pageviews for "Owl", "Cheese", "Taylor Swift" and friends, Apple keynotes, Game of Thrones episodes, Eurovision) and nature (owl, cuckoo and stork records, earthquakes).
- Each one on three pairs, 411 tests in total. The question each time: when the indicator is "on" (a full moon, a Bayern win, a rainy weekend), does the pair do better or worse over the next day, week or month than when it is "off"?
- No peeking ahead: an indicator only counts once it is known. A Sunday football result can only affect a trade opened after the weekend.
- Train and test: each indicator was judged on 2010–2018. The years 2019–2026 were kept aside to see whether the winners still worked on years that took no part in the selection.
- A control group of pure noise: we pushed 9,000 random number series through exactly the same test, to see how good nothing can look.
- Everything written down first: the rules, the groups and what counts as success were fixed before any indicator was scored.
What happened
The best indicator in each group, chosen on 2010–2018 only. The number in brackets is a standard score of how far a result is from what chance would give: 0 is nothing, about 2 or more is what researchers usually call "significant".
| Indicator | What it "predicted" | Before 2019 | After 2019 |
|---|---|---|---|
| Max Verstappen won the weekend's F1 race | EUR/CHF up | very strong (4.5) | reversed, lost money |
| The Moon is waxing | EUR/USD down | strong (2.9) | nothing (0.3) |
| More owls reported in Switzerland than a year ago | USD/CHF up | strong (2.8) | reversed, lost 0.4% a month |
| Friday the 13th | EUR/USD down | strong (2.6) | nothing (0.7) |
| Rain on both Saturday and Sunday in London | EUR/USD up | strong (2.6) | still there (2.1) |
Four of the five champions collapsed. The F1 one is the classic trap: its impressive score came from just five Verstappen wins before 2019.
The chart shows all 411 tests. Each dot is one indicator on one pair: how good it looked before 2019 (left to right) against how it did afterwards (bottom to top).
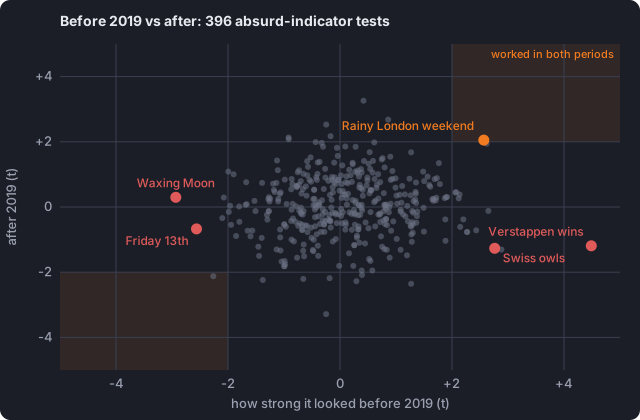
How to read it: if the past predicted the future, the dots would line up along a diagonal. Instead they form a round cloud. Looking great before 2019 told you nothing about after 2019. The shaded corners are where an indicator worked in both periods. A few dots land there, about as many as chance puts there.
Noise looks better than our indicators. Only 4% of our indicator tests reached a correlation of 0.8 with the price in their best two-year window. Of the random series, 41% did, and a typical random series reached 0.67. That Nicolas Cage chart is not special. Any two lines that drift over time will match somewhere.
The one that refused to fail
The London rule: if it rained at least 1 mm on both Saturday and Sunday in London, buy EUR/USD at Monday's open and sell at Friday's close. We tried hard to break it:
- Before and after 2019: EUR/USD did 0.41% a week better than usual before 2019, and 0.25% better after.
- Sixteen years: the rainy-weekend weeks beat the other weeks in 13 of 16 years.
- Not the season: rainy weekends are spread across the whole year. Compared only with dry weeks of the same month and year, the effect is the same size.
- Not a few lucky weeks: take out the ten best rainy weeks and it is still there.
- Not just any rain: the same rule for Zurich, Geneva, Frankfurt or New York does nothing.
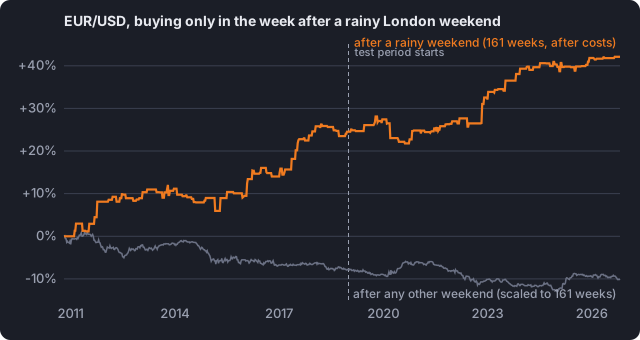
How to read it: the orange line is what you would have made trading only the 161 weeks after a rainy London weekend, after costs: about +42% over 16 years, and it kept rising after 2019. The grey line is the same number of ordinary weeks, which lost money.
It is the most convincing chart in this study. If someone sold it to you as a "proprietary weather model", you would have a hard time proving them wrong.
Why it is still (almost certainly) luck
- We tried 411 things. On its own, a result this strong comes up by chance about 1 time in 2,500. But we gave chance 411 attempts. The odds that at least one of 411 tries looks this good by pure luck are roughly one in six. Finding one survivor is unremarkable.
- The rest of the group says noise. 8 of our 411 tests passed on the test years. Pure chance would give about 5. That is not a meaningful gap.
- There is no mechanism. London weather is not an input to anyone's currency model.
- The checks came after the pick. Every check above was chosen after we already knew London had won. They show it is not one obvious accident, but they cannot undo the fact that we picked it from 411.
So, should you check the London forecast?
Probably not. Charming as the rain is, none of the 137 indicators earned the title of a method. The one that looks like a method is the best of 411 tries, which is what the best of 411 tries always looks like. The lesson is not "forex can't be predicted". The lesson is that a great backtest proves nothing until you know how many backtests were run to find it. It is a good question to ask anyone selling a strategy.
What would change our mind
- A test on future weekends. Every London weekend is public and free to record. If the effect is real, it should keep showing up in weeks that did not exist when we picked it. A year gives about ten rainy weekends, so it would take several years to tell.
- A reason. A pattern with no mechanism behind it needs much stronger evidence than one with a clear cause.
- The same result in other places, for example GBP/USD, or the same effect showing up in other rainy financial centres. Zurich and Frankfurt already said no.
The other champions, and what happened to them after 2019
- Max Verstappen wins → sell the franc (EUR/CHF up). The strongest score of the whole study before 2019 (4.5), built on just five Verstappen wins. After 2019, with dozens more wins, it turned the other way and lost about 0.05% a week after costs.
- The waxing Moon → EUR/USD down. Clear before 2019 (2.9). After 2019: nothing (0.3), a small loss after costs.
- More Swiss owls than a year ago → USD/CHF up. Convincing before 2019 (2.8). After 2019 it reversed and lost about 0.4% a month.
- Friday the 13th → EUR/USD down. Before 2019, EUR/USD did about 0.3% worse on those days (2.6). After 2019, the curse wore off (0.7), and the rule made nothing.
And the prettiest charts
They were never champions, only good-looking. Nicolas Cage films and EUR/USD moved together at 0.93 in 2014–2015, sunspots and EUR/USD at −0.91 in 2021–2022. Over the full 16 years, both correlations are about zero (0.05 and 0.02).
Everything behind this article, including the data, the 137 indicators, the rules written before the test and every result, is in the study files. Nothing was left out, including the 410 losers.