Penny-stock lottery tickets vs just holding SPY: ten years, one lucky year
Picture a stock that used to cost $10 and now costs 50 cents. It can only lose another 50 cents. If the company recovers, it could be worth $5 again. Now buy ten stocks like that every month, for ten years, and wait for the comebacks.
We tested exactly that: $100 a month, split into ten $10 bets on crashed US stocks under $1, 6,029 bets in all, on prices that include the companies that later went bust. At first glance it worked: the average bet kept pace with simply holding SPY, a fund that tracks the 500 largest US companies. Then we looked at where that average came from.
The pitch
A crashed stock is a lottery ticket. Most of them will lose, but the losses are small and capped at $10 a ticket, while a winner can pay $50 or $100. Buy enough tickets and one big win should cover the rest. Unlike the real lottery, the odds are not set by someone who profits from your ticket. Or so the idea goes.
The 2021 meme-stock wave made the idea famous: GameStop, AMC and a long list of forgotten companies went up ten or a hundred times in a few weeks.
Why the idea is so tempting
- The winners are real and famous. Some stocks that traded for pennies in 2020 really did go up many times over in 2021, and their charts are all over social media.
- The losers disappear. A company that goes bankrupt stops trading, and its name vanishes from most free charting sites. Look up "penny stocks from 2018" on such a site and you only see the ones that survived. Researchers call this survivorship bias: judging by the survivors alone.
- The maths looks kind. You can lose $10 a bet but win $100. Surely the odds are on your side.
How we bought the tickets
- Prices: daily prices for about 20,000 US stocks from January 2015 to July 2025, built from minute-by-minute data (Finnhub, via a public dataset on Hugging Face). Crucially, the data includes stocks that were later removed from the exchange: Sears, J.C. Penney, Bed Bath & Beyond, Silicon Valley Bank and many smaller names. Without them, this test would be worthless.
- What we bought: on the first trading day of each month, every stock that closed between $0.30 and $1.00, had fallen at least 80% from its high of the past year, and still traded at least $50,000 worth of shares a day. That gave about 52 candidates a month, from 2016 on. We bought at the next day's opening price.
- The basket: each month, ten random picks from that list, $10 each. One random draw could be lucky or unlucky, so we repeated it 200 times for every month to see the whole range of outcomes.
- When we sold: six exit rules, each tested on its own:
- sell once the stock is up 20%, 30%, 200% or 300% (or after 12 months if it never gets there);
- sell once the price falls 40% below its best close since we bought (or after 24 months);
- just hold for 12 months.
- Costs: 1.5% lost on the way in and 1.5% on the way out. Stocks this cheap have a wide gap between the price you can buy at and the price you can sell at, and this is a fair estimate of what that gap costs.
- The comparison: for every bet, what SPY did over exactly the same dates.
- Stocks that stopped trading: about a third of the bets ended early because the stock stopped trading. We do not know what a holder got in the end: sometimes a buyout, often nothing. So we report two versions. The optimistic one sells at the last traded price. The pessimistic one counts the bet as a total loss. The truth is somewhere in between. Unless we say otherwise, the numbers below are the optimistic ones.
- No years kept aside. We did not save a separate stretch of years to check the result on. Instead, we look at every year separately. Why that matters is explained in How to backtest a trading idea without fooling yourself.
What a $100 basket did
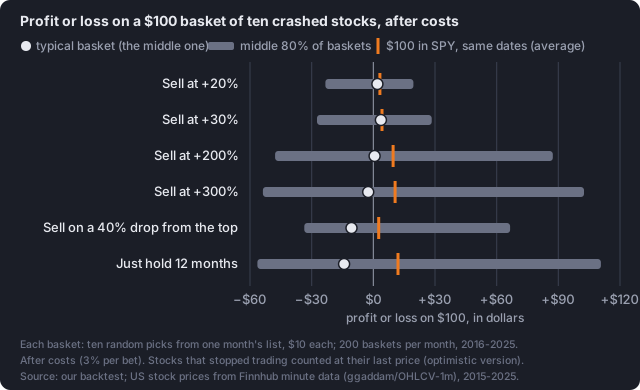
How to read it: each row is one exit rule. The grey bar shows what most baskets did: we left out the luckiest tenth and the unluckiest tenth, and the bar covers the 80% in between. The white dot is the typical basket: line all the baskets up from worst to best, and it is the one in the middle. The orange tick is what the same $100 in SPY made over the same dates.
- The typical basket barely moved or lost money. Selling at +20% or +30%, it made $2 to $4. Selling at +200%, about $1. Selling at +300%, on a 40% drop, or holding for a year, it lost $3 to $14.
- SPY beat the typical basket under every rule. Holding for 12 months, the typical basket lost $14 while $100 in SPY made $12.
- The range is huge. Holding for 12 months, one basket in ten lost more than $56 of its $100, and one in ten more than doubled. That range is what makes it feel like a lottery, and it is why everyone knows someone who "made a fortune on penny stocks".
Then why does the average look fine?
Holding each bet for 12 months, the average bet made +13.3% after costs, against +12.0% for SPY. On that number alone, the lottery tickets look as good as the index. So how can the typical basket lose money?
Because an average and a typical result are not the same thing. Take ten bets: one goes up 1,000%, nine lose half their value. The average bet made +55%. Nine out of ten people holding one of those bets lost money. Penny stocks look a lot like that:
- The typical bet lost 42%. A handful of stocks that went up ten times or more pull the average up. You own only ten bets, so you usually miss them.
- More than 1 bet in 10 lost 90% or more, and a third of the stocks stopped trading before the 12 months were up. Counting those as total losses (the pessimistic version), the average bet lost 10.2%.
- And almost all of the gain came from one year.
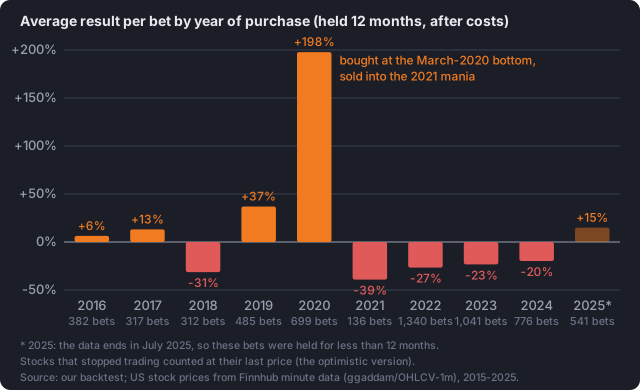
How to read it: each bar is the average result of all the bets bought in that year and held for 12 months, after costs. Orange bars made money, red bars lost it. The 2025 bar is pale because the data ends in July 2025, so those bets did not get their full 12 months.
Stocks bought in 2020 made +198% on average: crashed companies bought around the March 2020 market crash and sold a year later, in the middle of the 2021 meme-stock mania. 2019 was good too (+37%), probably helped by the same rebound: bets bought late in 2019 were still open in late 2020. The other years were ordinary or bad. Bets bought in 2018, 2021, 2022, 2023 and 2024 lost 20% to 39% on average.
Leave out the bets bought in 2020, and holding for 12 months made −10.9% per bet (−32.5% in the pessimistic version), while SPY made +9.6% over the same dates. Even the safest-looking rule, selling at +30%, lost 2.8% per bet without 2020.
So the strategy did not have an edge. It had one lucky year, and you had to be in it at exactly the right moment.
Where the costs bite
Getting in and out of a sub-$1 stock costs about 3% of the bet. Here is the average bet, with and without that cost:
| Exit rule | Average bet, before costs | After costs | SPY, same dates |
|---|---|---|---|
| Sell at +20% | +2.3% | −0.7% | +3.2% |
| Sell at +30% | +3.7% | +0.6% | +4.2% |
| Sell at +200% | +12.8% | +9.5% | +9.6% |
| Sell at +300% | +14.1% | +10.7% | +10.6% |
| Sell on a 40% drop from the top | +7.4% | +4.2% | +2.6% |
| Hold 12 months | +16.8% | +13.3% | +12.0% |
Before costs, the long-shot rules (the last four rows) beat SPY by 3 to 5 percentage points per bet. The costs ate most of that. What is left after costs is a point or two at best, and it rests on 2020 and on the optimistic version, where a stock that stopped trading still counts at its last price. One small thing tilts the table the other way: our SPY figures leave out the dividends (the cash SPY pays out, roughly 1.5% to 2% a year), which would add a little to SPY. SPY itself carries no cost here, because buying it costs next to nothing.
Could smarter picking fix it?
Two filters on the penny stocks. We kept only stocks that had already bounced at least 30% off their low of the past 50 trading days, or only those trading at least $500,000 a day. Neither changed the picture: the typical bet still lost money with the long-shot rules, and the pessimistic version was still below SPY.
Buying winners instead of losers. The opposite lottery: buy any stock the day after it closes at its highest price of the past year, and hope the run continues. We sold either after three months, or with a trailing stop: sell once the price falls 15%, 25% or 40% below its best level since we bought. We ran about 92,000 such test trades, on stocks above $5 that trade at least $5 million a day, and on stocks between $0.50 and $5. Every version did worse than SPY over the same dates: the pricier stocks by 1.4 to 7.7 percentage points per trade, the cheap ones by 0.9 to 3.7. With the trailing stops, most trades lost money while waiting for the rare big winner: the best 1% of trades produced 15% to 25% of all the gains. The only clearly good year was, again, 2020.
The bottom line: a fun ticket, not a plan
Fun to watch, but as a strategy, crashed penny stocks did not beat simply holding SPY. The typical $100 basket lost money, a third of the stocks disappeared, and the one stretch that made it look good, 2020 to 2021, was a market mania nobody could have planned for. A lottery ticket that pays out one year in ten is still a lottery ticket.
What could turn it into a strategy
- A way to spot the comebacks in advance. The whole profit comes from a few stocks per year. A filter that finds them before they move, and keeps working outside 2020, is the missing piece. Our two filters did not do it.
- Much cheaper trading. About 3% per bet, in and out, is the price of trading stocks this small. Every percentage point less goes straight to the result.
- Another 2020. A strategy that needs a crash followed by a mania to make money is a bet on the market's mood, not a method.
What this test cannot tell you
- One market, ten years. US stocks, 2015–2025, including several years of near-zero interest rates.
- Our own split detection. When a company merges, say, ten shares into one, the price jumps tenfold overnight without anyone making money. Our price data does not correct for that, so we detect these events from the price and trading volume ourselves. We checked it by hand on several well-known cases, but a few may have been missed.
- A few funds may be mixed in. We did not filter out exchange-traded funds and similar products that trade like stocks.
- Huge overnight jumps are cut off. When a stock jumped 4 times or more overnight with no share merge behind it, we stopped following it. This is usually a company coming out of bankruptcy under the same name, with new shares that have nothing to do with the old ones. A few real jumps are lost that way, which makes the result slightly worse than reality. The 2020–21 rallies still dominate it anyway.
- The "buy winners" test counts trades, not a real account with a limited amount of money.
Everything behind this article, including the scripts, the rules and the full result tables, is in the study files.
Educational content, not financial advice.