Mondays, month-ends and Fed days: do stock calendar effects still pay in 2026?
Ask an old stock trader about the calendar and you get a list. Sell before the weekend, because Mondays are bad. Buy at the end of the month, when pension money flows in. Be in the market the night before the Federal Reserve announces its interest-rate decision. Never be out of it the day before a holiday. Some of these come with famous research papers. And a calendar is known years in advance: no charts, no news, no guessing. If any of these days really did better, you could plan the whole year's trades on 1 January and go fishing.
We tested five of these "good days" on almost 27 years of daily prices for SPY (a fund that tracks the 500 largest US companies) and five other index funds. Stocks rise over time anyway, so "do they go up?" is the wrong question. Ours was: do they go up by more than an ordinary day, by enough to pay for the trade, and by enough to beat simply staying invested?
Five dates the textbooks swear by
- Mondays. The oldest one: stocks were said to do worse on Mondays.
- The turn of the month. The last trading day of a month plus the first three of the next, when salaries and pension money arrive.
- Overnight instead of daytime. Buy at the close, sell at the next open. The claim: the US market makes most of its gains while the exchange is closed.
- Fed decision days. The Federal Reserve sets US interest rates at eight scheduled meetings a year and announces the decision at 2 pm New York time. A well-known 2015 paper by David Lucca and Emanuel Moench found that US stocks rose unusually strongly in the 24 hours before those announcements. We tested the whole Fed day, and separately the night before it (from the previous close to the Fed day's open).
- The day before a market holiday. Christmas, Thanksgiving and so on: a good mood, thin trading.
How we set up the test
We wrote down every rule, the costs and the pass mark before computing anything. (Why that matters is in our guide to backtesting without fooling yourself.)
- Units. These numbers are tiny, so we use basis points (bp): one hundredth of a percent. On $10,000, 1 bp is $1.
- The comparison is an ordinary day, not zero. SPY rose by about 2.6 bp on an average day in 2000–2018 and about 7 bp in 2019–2026. A calendar day only counts as special if it beats that. We call the difference the extra return. Dividends are included.
- Costs. Buying and later selling SPY at the open or close (a round trip) costs about 1.5 bp, mostly the gap between the buying and the selling price. A rule that trades every night pays it every night; the four-day turn of the month pays it once. At 1 or 2 bp, no conclusion changed.
- A held-back test. 2000–2018 was the first look. 2019 to October 2026 was the exam, and a rule had to work in both. The exam is smaller: 62 Fed days, 73 days before a holiday.
- The pass mark. A profit after costs in both periods; an exam result clearly bigger than everyday noise (a standard score of at least 2, what researchers usually call "significant"); and the same direction on at least 3 of the 5 other funds: QQQ (big tech), IWM (small companies), DIA (the Dow Jones), EFA (Europe and Asia) and EWJ (Japan).
- A luck check. We also drew the same number of days at random, 10,000 times, and counted how often random days did as well. If 1 draw in 5 does, the "effect" could easily be luck. If 1 in 100 does, it probably isn't.
- Mondays and the other weekdays were side checks: they can describe, not prove.
The scorecard
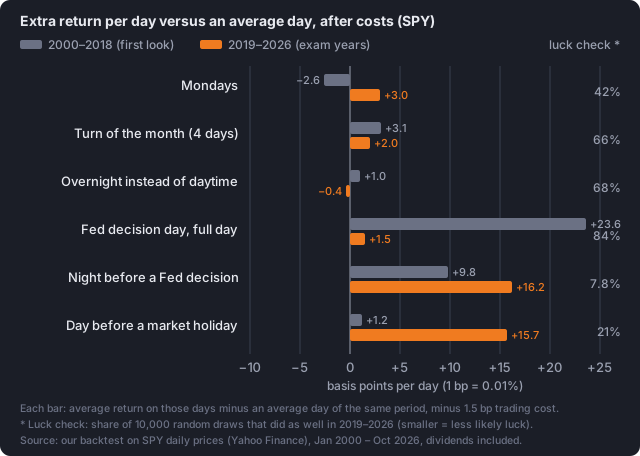
How to read it: grey is the extra return per day after costs in 2000–2018, orange the same in the exam years. Right of zero means those days beat an ordinary day. On the right: the luck check for 2019–2026. In the text we quote the extra return before costs.
Mondays: no longer bad, not good either. In 2000–2018 Mondays did 1.1 bp worse than an average day; in 2019–2026, 4.5 bp better. Both are noise: 42% of random draws did as well. No other weekday stood out either.
The turn of the month: a whisper. Those four days beat an ordinary day by 3.5 bp in the first period and 2.4 bp in the exam years. Right direction, wrong size: two thirds of random draws did as well, it was positive in only 4 of the 8 exam years, and negative on small companies (IWM) and Japan (EWJ).
Overnight instead of daytime: true on paper, eaten by costs. On SPY the night beat the day by only 2.5 bp in 2000–2018 and 1.1 bp in 2019–2026, against a cost of 1.5 bp a night. That leaves 1 bp early on (noise) and a small loss in the exam years. Small companies were the exception (IWM: 8.1 bp in the exam years). On the Europe and Japan funds it reversed: their home markets trade while New York sleeps.
The full Fed day: it faded. In 2000–2018, the day of a Fed decision beat an ordinary day by 25 bp, a big number. But most of it came from 2008–2015, the years of crisis and emergency rate cuts (+49 bp). In 2016–2018 it was −18 bp, and in the exam years +3 bp, which 84% of random draws matched. The session from the open to the close, with the 2 pm announcement inside it, went from +14 bp to −15 bp, negative on all six funds in the exam years.
Two rules did clear our bar. Before you get excited, read the next section.
The two that passed, and why we still don't trust them
The night before a Fed decision. Hold SPY from the close the day before a Fed decision to the open on the day itself. In 2000–2018 that night beat an average night by 11 bp, in 2019–2026 by 18 bp. It was positive in 15 of 19 early years, 6 of 8 exam years, and on all six funds. On paper, a pass.
The luck check is less kind: in the exam years 7.8% of random draws did as well, about 1 in 13, short of the 1 in 20 researchers usually want. And:
- One year carries a lot of it. Leave out 2020 and the extra return drops from 18 bp to 12 bp, which random days match 15% of the time.
- It was weak in 2010–2018 (+5.7 bp, well within noise).
Why the two checks disagree: the standard score judges those 62 nights by their own ups and downs, and Fed-eve nights happened to be calm. The random draws also pick up the wild days of 2020 and 2022. The stricter check says "not proven".
The day before a holiday. This one is stranger. In 2000–2018 it did nothing: +2.7 bp overall, −1.8 bp in 2010–2018. Then in 2019–2026 it beat an ordinary day by 17 bp, in all 8 years and on all six funds. But 21% of random draws did as well, 1 in 5. An effect that is absent for 19 years and then shows up in the most recent 8 looks much more like a lucky stretch than like a rule that was there all along.
And "all six funds" is less than it sounds: they move together most of the time, so as evidence six agreeing funds are closer to two or three.
The real test: would you have beaten just staying invested?
Suppose one of these effects is real. Using it means being in the market on those days and in cash the rest of the time. Here is what that earned in the exam years, after costs.
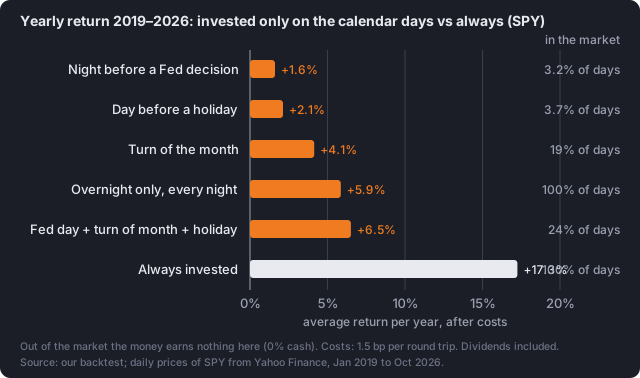
How to read it: each orange bar holds SPY only on its calendar days; the white bar holds it all the time. On the right: how much of the time each rule was in the market.
Holding SPY all along made 17.3% a year. The best calendar rule, all the calendar days combined (Fed days, turn of the month, days before holidays), made 6.5%, in the market about a quarter of the time. Overnight only made 5.9%: the nightly cost adds up. The two rules that passed made 1.6% (Fed nights) and 2.1% (days before a holiday).
Those two passing rules do give a very smooth ride, but mostly because the money sits in cash 96% of the time, and a smooth ride in cash is not an edge. Here cash earned nothing; counting interest (about 3% a year since 2019) helps, but they still trail staying invested by a wide margin.
In 2000–2018, a weak period with two big crashes, the combined rule did keep up (4.8% a year against 4.9%), with a smoother ride. In the exam years it fell far behind.
So, is the calendar worth trading?
Not in 2026. Mondays, the turn of the month and the full Fed day show nothing beyond everyday noise in recent years, and buying every night is eaten by costs. The two rules that cleared our pass mark fail the stricter luck check, and even if they were real, sitting out the other 96% of days costs far more than they add.
The night before a Fed decision has the better case of the two: it is the overnight half of the window the 2015 paper described, and it was positive in both periods and on every fund. Better, but not proven.
What would change our mind
- More strong Fed nights without a 2020 doing the heavy lifting. At eight decisions a year, that takes years.
- Pre-holiday days staying strong through a full market cycle, bad years included.
- A version that adds to staying invested instead of replacing it, such as a bigger position on those days. We did not test that.
The fine print
- Daily prices only. The 2015 paper measured from 2 pm the day before to 2 pm on the Fed day. Daily open and close prices cannot build that window, so our Fed tests are close stand-ins.
- Emergency Fed moves are left out (2001, 2008, March 2020): nobody knew their dates in advance.
- The exam years are one long rising market with one bad year (2022).
- Costs assume the opening and closing auctions, where SPY trades very cheaply. For smaller or foreign funds such as IWM and EWJ, the real cost is higher.
- One more side check: the week of the monthly options expiry (the week with the third Friday) did worse than average days in 2019–2026 on all six funds, after doing nothing in 2000–2018. Its score was below our bar, and we have not tested it further.
Everything behind this article, including the rules written before the test, every result on all six funds and the list of Fed dates, is in the study pack.
Educational content, not financial advice.