Does the forex weekend gap fill? Yes. The catch is when
Every Friday evening the currency market shuts for two days. The news does not. On Sunday evening trading starts again, and the first price is often not where Friday ended. Ask on any trading forum what happens next and you will get the same answer: "the gap always fills." We checked that on 16 years of prices for 21 currency pairs. The saying turned out to be more true than most trading folklore. And it still doesn't pay, which makes it a neat lesson in the difference between "true" and "tradable".
The forum wisdom
Currencies trade around the clock on weekdays, but the market closes from Friday evening (21:00 or 22:00 UTC, depending on the time of year) until Sunday evening, when trading restarts in Asia. Over the weekend things keep happening: an election, a central banker's interview, a political crisis. So the first price on Sunday evening can sit above or below Friday's last price.
- The weekend gap is that jump: Sunday's first price minus Friday's last price.
- The gap fills when the price later comes back and touches Friday's last price.
The trade that follows is simple. If the market opened higher, sell and aim for Friday's price. If it opened lower, buy. Most gaps are small: on the biggest currency pairs, half are about 7 pips or less. (A pip is the smallest usual price step: 0.0001 for most pairs, so EUR/USD moving from 1.1000 to 1.1007 is 7 pips; for pairs priced in yen it is 0.01.) That is about a tenth of a normal day's move. But after a dramatic weekend the gap can be many times bigger, and then it looks like free money.
Where the belief comes from
- You can see it on any chart. Gaps are easy to spot, and the ones that close within hours are the ones you remember.
- There is a story. On Sunday evening only a few banks are trading, so the first prices can overshoot. Then Asia and Europe wake up and the market "corrects".
- It borrows credibility from stocks, where "gaps get filled" is one of the oldest chart rules.
How we measured it
We wrote down the rules, the costs and what would count as a pass before looking at any result. (Why that matters is in our guide to backtesting without fooling yourself.)
- Pairs and data: hourly prices from October 2010 to October 2026. The main set was the 7 major pairs, the ones that include the US dollar (EUR/USD, USD/JPY, GBP/USD, USD/CHF, AUD/USD, USD/CAD, NZD/USD). The 14 crosses, pairs without the dollar such as EUR/JPY or GBP/CHF, were a second, independent check. That is about 17,400 pair-weekends.
- Which gaps: a 20-pip gap is huge for a calm pair and routine for a jumpy one, so we measured each gap against that pair's normal day (the average distance between the day's high and low over the previous five days). We focused on bigger gaps, over a quarter of a normal day. About 15% of weekends have one on the majors, 22% on the crosses.
- Question one, before any trading: does the price touch Friday's last price more often than it touches any level the same distance away? Say the market opened 20 pips higher. We compared "comes back down 20 pips to Friday's price" with two baselines: "goes up another 20 pips" (the opposite level) and "moves 20 pips from a random point in the first hours, in a random direction". If the saying were empty, all three would happen about equally often.
- Question two, the trades: bet on the fill, with Friday's price as the target. We tried entering one or two hours after the open, with and without a stop-loss (an automatic exit if the price moves the wrong way by one gap's size), closing on Monday morning or Monday evening, and four minimum gap sizes. That gave 48 versions, plus 48 mirror-image versions that bet on the gap growing. Each was run on majors and on crosses.
- Costs: the broker's fee is the spread, the difference between the price you buy at and the price you sell at. We used a typical retail spread for each pair (0.8–1.6 pips on the majors, 1.2–3 pips on the crosses) and tripled it for trades opened on Sunday evening, when spreads are known to be much wider. We also tried five times.
- Two periods: we split the history into 2010–2018 and 2019–2026. A rule had to work in both.
- What counts as a pass: a profit after costs in both periods, positive on most pairs, on both majors and crosses, and clearly not luck in 2019–2026. For "not luck" we used a standard score of how far a result is from what chance gives: 0 is nothing, about 2 is what researchers usually call "significant". Because we were trying 96 versions, and some would look good by accident, we asked for 3.
What happened
The gap really does fill more often than chance. For bigger gaps on the majors in 2019–2026, the price got back to Friday's level by Monday evening 70% of the time. A random level the same distance away was reached 48% of the time, the opposite level only 35%. The crosses show the same picture. So do the earlier years, a little weaker.
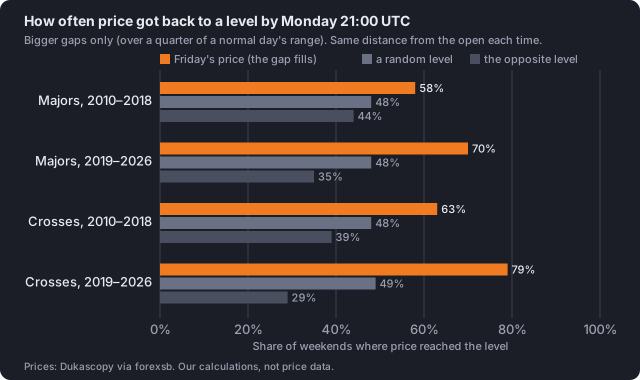
How to read it: each group of bars is one set of pairs in one period. The orange bar is how often the gap filled by Monday 21:00 UTC. The grey bars are the two baselines. In every group the orange bar is clearly the longest. On this question, the forums are right.
So why not just bet on it? Because a fill rate is not a profit. Two things get in the way: timing and costs.
Most of the move is over before you can trade it. Take the average move from the first Sunday price toward Friday's price. Roughly 60% to 75% of it happens in the first hour. And in 2019–2026, 15% of bigger gaps on the majors and 23% on the crosses had already filled completely within that hour, before an hour-later trade could even start.
To see how fast it happens, we repeated the trade on 15-minute prices for the majors, entering at different times after the open. This check was added after the main test, so it describes what happened rather than counting as a second test.
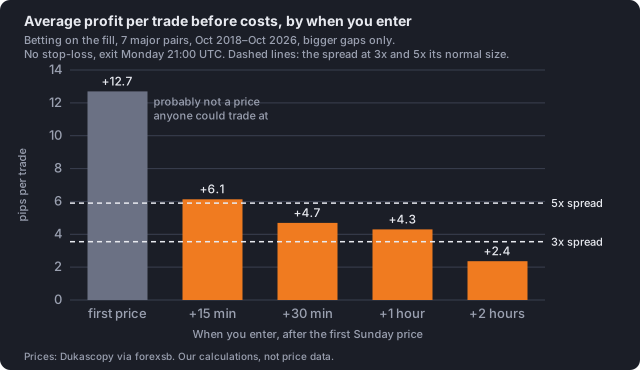
How to read it: each bar is the average profit per trade before costs, depending on when you enter (this version has no stop-loss, so the numbers are a bit higher than in the table further down). The dashed lines are what the spread costs if it is three or five times its normal size. A bar has to clear a line to make money at that cost.
- At the very first price: +12.7 pips a trade, about ten times the normal spread. Spectacular. Also not real, see below.
- 15 minutes later, half of it is gone.
- After two hours, it is below even the cheaper cost line.
The grey bar is not an opportunity. The first quote after the weekend is the least reliable price of the week: few dealers, wide spreads, sometimes a stale quote that nobody actually traded at. Part of the "fill" may simply be that first price being wrong. And the spreads brokers quote in those first minutes are widely reported to be 5 to 20 times their normal size.
What about the orange bars that clear the 3x line? Entering 15, 30 or 60 minutes after the open leaves +2.6, +1.1 and +0.8 pips a trade at three times the normal spread. That is a pip or two at most, and luck explains it easily: the scores are 1.6, 0.7 and −0.3, against the 3 we required. (The score measures each trade against its pair's normal day, so every pair counts equally. The pip average lets a few large gaps count for more, which is how a positive pip number can come with a negative score.) At five times the spread they become +0.2, −1.2 and −1.6. So: a faint hint, not an edge.
What the costs ate
Here is the version we picked in advance as the main one: bet on the fill one hour after the open, stop-loss at one gap's size, close on Monday at 21:00 UTC, bigger gaps only. 2,889 trades on 21 pairs.
| Pairs | Period | Before costs | Spread paid | After costs |
|---|---|---|---|---|
| Majors | 2010–2018 | −0.1 pips | 3.5 pips | −3.6 pips |
| Majors | 2019–2026 | +2.5 pips | 3.5 pips | −1.0 pips |
| Crosses | 2010–2018 | +5.4 pips | 6.2 pips | −0.8 pips |
| Crosses | 2019–2026 | +5.2 pips | 6.3 pips | −1.1 pips |
Average per trade. One hour after the open it is still Sunday evening, so the tripled spread applies.
Before costs the trade mostly makes a little, as the fill rates promise. Then the Sunday spread takes all of it and a bit more. Turned around: on the majors in 2019–2026 the trade only breaks even if the Sunday spread is at most about 2.2 times normal, and on the crosses 2.5 times. Sunday evening is rarely that generous. The main version lost money in 11 of the 17 calendar years on the majors, and in 11 of 17 on the crosses.
None of the 96 versions passed, on either set of pairs. The rest of the grid told the same story:
- Waiting longer made it worse. Entering two hours after the open instead of one, the trade made less before costs, and on the crosses it lost money even before costs in 2019–2026.
- Closing on Monday morning instead of Monday evening was worse everywhere.
- Betting on the gap growing lost in nearly every version, as the fill rates suggest it should.
The best-looking version was on the crosses: gaps over half a normal day, enter one hour after the open, no stop-loss, close Monday evening. It made +9.3 pips a trade after costs in 2010–2018 and +5.8 in 2019–2026. That looks like a winner until you look inside: the average is carried by a handful of large gaps on yen pairs. With every pair counted equally, its score was 0.0 in the earlier years and 2.3 in the later ones. That was the best score of all 192 runs, and still short of the 3 we asked for.
So: it fills, but can you collect?
The weekend gap does fill, well above chance, on 16 years and 21 pairs. The forums got that part right. But the fill is a first-minutes effect. It happens when spreads are at their widest of the week and the prices on the screen are at their least real. By the time a retail trader can reasonably get in, what is left is too small to pay for the trade. The only version with a big edge, entering at the very first quote, is exactly the one you can't trade at retail prices, and can't test honestly with this kind of data.
What would make it tradable
- Normal spreads in the first minutes after the Sunday open. You would need a broker quoting close to its usual spread at that hour, and a record of real trades at those prices to prove it.
- Tick-by-tick data with real buy and sell prices. Hourly prices cannot tell a real first trade from a stale quote, or show what the spread actually was. Until that is tested, the biggest part of the effect could be a quirk of the data.
- More big gaps. Gaps bigger than a whole normal day produced the biggest profits in 2010–2018, and a mixed bag after. They happen on about 1 weekend in 100 or fewer: 35 on the majors and 115 on the crosses in 16 years. That is too few to tell an edge from luck.
The fine print
- Sunday spreads are an assumption. The data has no real Sunday spreads, so "three times normal" is our estimate. If your broker charges less, the numbers improve a little, but the main version only breaks even if the Sunday spread is about twice normal or less.
- Pips are not all equal. A pip on a yen pair is a different amount of money from a pip on EUR/USD, and yen gaps tend to be large in pips. Our pass/fail scores measure every trade against its pair's normal day instead, so each pair counts equally.
- Hourly prices hide what happens inside the hour. When a trade's target and stop-loss were both touched in the same hour, we counted it as a loss.
- The 15-minute check came after the main test, and holiday weekends when the market reopened on a day other than Sunday were left out.
Everything behind this article, including the rules written before the test, all 192 results, the 15-minute timing check and every trade of the main version, is in the study files.
Educational content, not financial advice.