Can clever position sizing rescue a weak strategy? We tried six rules
Ask on any trading forum why a strategy isn't making money and someone will tell you: it's not your entries, it's your position sizing. Bet more when the market is calm, less when it is wild. Step aside after a losing streak. Spread the risk evenly. We had the perfect patient for this advice: a currency strategy of ours that made a little money, but not enough to tell apart from luck. We gave it six of these sizing rules and 16 years of prices. Here is what each one did, and the bit of school math that predicts the result before you run a single test.
The advice
Position sizing is how big each trade is, separate from which trades you take. The most popular serious version is volatility targeting. Volatility simply means how much prices, or your account, swing up and down. A volatility-targeting rule looks at how wild the last few weeks were and sets the trade size so that the account swings by about the same amount every year: bigger positions when markets are quiet, smaller ones when they are stormy.
The other rules are variations on the theme. Risk parity gives every part of a portfolio the same share of the risk. Brakes stop trading when things look bad. The promise: the same entries and exits, but a smoother ride, fewer disasters and a better result.
Why it sounds so convincing
- Big funds do it. Many large funds size their positions to a target level of risk.
- There is research behind it. An often-cited 2017 paper (Moreira and Muir, "Volatility-Managed Portfolios") found that cutting stock exposure when markets got wild made several well-known stock strategies earn more for the risk they took.
- It feels like discipline. Stepping aside after a bad quarter sounds like exactly what a careful trader should do.
- It visibly changes the numbers. Return, swings and worst loss all move, so it is easy to believe the strategy itself got better.
The math in one paragraph
To compare strategies fairly, you divide the yearly return by how much the account swings in a typical year. That gives return per unit of risk (professionals call it the Sharpe ratio). Ours made 1.1% a year, and in a typical year the account swung about 4.1% above or below that, so it scored 0.28. Now double every position. The return doubles, the swings double, and the score stays exactly 0.28. Making bets bigger or smaller never changes the score on its own. The only way a sizing rule can improve it is timing: putting more money on in periods when the strategy happens to work better, and less when it works worse. Get the timing wrong and the score drops. And every size change costs a fee. So the whole question is: does the timing help enough to pay for itself?
The experiment
The strategy: each day, on seven dollar pairs (EUR/USD, GBP/USD, AUD/USD, NZD/USD, USD/JPY, USD/CHF, USD/CAD), it buys or sells wherever four slow ingredients point on average, with the same fixed size in each pair. Each ingredient did slightly better than nothing in our earlier studies:
- Carry: prefer currencies that pay higher interest rates.
- Crowd positioning: bet against big speculators when their bets get crowded (from a weekly report by the US futures regulator, the CFTC).
- Value: prefer currencies that look cheap once inflation is taken into account.
- Fed liquidity: lean against the dollar when the US central bank is pumping money into the system.
The ingredients were not touched in this study. Only the sizing changed.
Six sizing rules, fixed before any result was computed:
- Steady risk, fast: resize daily so the account swings about 6% a year, judging the recent wildness mostly from the last month or so.
- Steady risk, slow: the same, judging from roughly the last two to three months.
- Steady risk per pair: give each pair the same risk (smaller positions in the wild ones), then resize the account to 6%.
- Risk split by ingredient: give each ingredient the same share of the risk (risk parity), then resize to 6%.
- Stop after a losing stretch: stay out whenever the strategy lost money over the previous 63 trading days (about two and a half months).
- Stop when markets get wild: stay out when the last month was more than 1.5 times as wild as the last year.
No peeking ahead: every rule used only data up to the day before. Positions were capped at 3 times the account.
Real costs: the broker's spread (the gap between its buy and sell price) on every change of size, however small, plus swap: the overnight interest a broker charges or pays for holding a position, here with a 1% a year markup.
Train and test: 2011–2018 to judge the rules; 2019 to October 2026 kept aside as a test.
A yardstick: a second version of the original that bets in proportion to how strongly the four ingredients agree, and trades small when they disagree. It isn't a sizing rule bolted on top, but a different way of building the same strategy. It turned out to matter.
What counts as a pass, written down first: a better return per unit of risk than both the original and the yardstick, in both periods, and a test-period result clear enough not to be luck. For that we use a standard score of how far a result is from pure chance: 0 is nothing, about 2 or more is what researchers call "significant". (Our guide to backtesting explains why each check matters.)
What happened
No rule passed. Five of the six did not even beat the original in both periods.
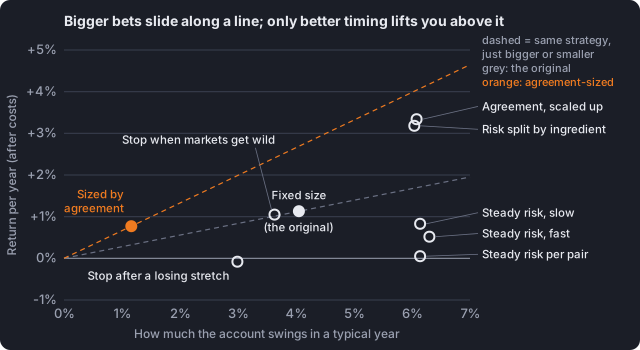
The chart shows all of them: left to right is how much the account swings, bottom to top is the yearly return.
Source: our backtest, 2011–2026, on hourly prices from Dukascopy (via forexsb). Whole-period figures after costs and swap.
How to read it: each dashed line is "the same strategy, just bigger". Sliding along it changes the return and the swings together, and nothing else. A real improvement has to land above the line of the strategy it started from. Every steady-risk rule and both brakes landed on or below the grey line of the original.
- Steady risk made it worse, fast or slow. The rules ended up betting 1.6 to 1.8 times the account on average instead of 1, so the worst loss from a high point almost doubled (from −8.2% to about −15%). The yearly return still went down, from 1.1% to 0.5–0.8%.
- Steady risk per pair was the worst: +0.1% a year, with a −19% worst loss.
- The losing-streak brake killed what little edge there was. It sat out almost half the time, lost 0.1% a year, and still had a deeper worst loss than the original (−11.4%).
- The volatility brake was a wash: a bit better before 2019, a bit worse after.
- Risk split by ingredient looks like the winner, at +3.2% a year, and it did beat the original in both periods. But it quietly changed the strategy: it adds up how strongly each ingredient points, which is what the yardstick does, and then bets about six times bigger than the yardstick. Per unit of risk it scored lower than the yardstick in both periods (0.67 vs 0.78 before 2019, 0.38 vs 0.54 after), so on the chart it sits below the orange line. Its test-period score was 1.1, far from 2. (The original's was 0.6.)
Where the timing went wrong
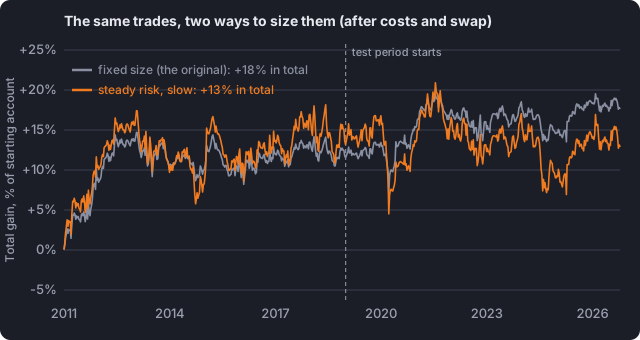
The slow steady-risk rule shows the problem best. It took the biggest positions after calm stretches, and for this strategy those were exactly the stretches that lost.
Source: our backtest on hourly prices from Dukascopy (via forexsb). Running total of daily results after costs and swap, in % of the starting account, not compounded.
How to read it: both lines take exactly the same trades. Before 2019 the steady-risk version (orange) runs a little ahead, mostly thanks to 2011. Then it falls behind: in 2020 it lost 2.4% while the fixed size made 2.4%; in 2024 it lost 7.5% against 3.7%. Final score by October 2026: fixed size +18%, steady risk +13%, with a bumpier ride.
The bill for all that resizing
Resizing every day isn't free. The slow steady-risk rule traded almost twice as much as the original and held bigger positions overnight. The extra spread and swap cost about 0.5% a year, more than double what it gained before costs (0.2%). So it ended at +0.8% a year against the original's +1.1%.
Swap was the bigger bill for every version (about 0.6% a year for the original, 1% for the steady-risk rule): the carry ingredient earns some interest, but the broker's 1% markup costs more. And costs are not the whole story. Even before swap, the steady-risk rule earned less per unit of risk than the original, in both periods.
The one thing that did help
The biggest improvement in the study came from no sizing rule at all, but from the yardstick: betting in proportion to how strongly the ingredients agree. Over 2011–2026 that more than doubled the return per unit of risk (from 0.28 to 0.67), cut the worst loss from −8.2% to −2.4%, and had 14 profitable years out of 16 (the original: 11).
Before anyone gets excited: it isn't a proven edge either. Its test-period score was 1.6, short of 2. We found it in this same study, and the ingredients themselves were picked because they did well before 2019. At its natural size it earned a sleepy 0.8% a year. Scaled up to 6% swings (an extra version we tried after seeing the results), it made about 3.3% a year, with drops of around 12% along the way. Modest and plausible, not something to rush into.
Our take: sizing is a volume knob, not an engine
None of the six rules turned our weak strategy into a good one. Steady risk lowered the return per unit of risk; the brakes killed the edge or changed nothing; the one big yearly return came from combining the ingredients differently and betting bigger, not from smarter timing. Sizing changes how big the result is. It can't create an edge, and when its timing is wrong, it makes a weak result worse and bills you for the extra trading.
When sizing could be worth it
- An edge first. Sizing multiplies what is already there. A strategy you can't tell apart from luck at a fixed size won't become reliable at a different size.
- The right kind of strategy. Volatility targeting helps only when a strategy earns more per unit of risk in calm periods than in wild ones. That has been reported for some stock strategies. Ours did the opposite, and you can check this on your own strategy before trying it.
- A fair comparison. A sizing rule that "doubles your profits" by doubling your positions has done nothing you couldn't do with one setting. Compare return per unit of risk.
- Cheaper resizing. Small daily tweaks pay the spread every time. Resizing only on large changes would lose less, but that is a new rule, to be tested as one.
Everything behind this article, including the rules written down before the test, the code and every result, is in the study files. Nothing was left out.
Educational content, not financial advice.