Trading the news: is the move really over in 30 minutes?
It is the first Friday of the month, 13:30 in London. The US jobs report is out, the number is far above what economists expected, and the dollar is leaping on every screen. The instinct is to jump in: a surprise this big must start a trend. The other half of the forum says it's too late: by the time you've read the headline, the professionals have done the trade and you are buying from them. We checked who is right on 15 years of US data releases and 1,056 central-bank decisions.
A surprise, and two ways to trade it
Some news arrives on a timetable. The US jobs report, non-farm payrolls (NFP), usually comes out on the first Friday of the month; the inflation figure, the consumer price index (CPI), mid-month. Central banks announce rate decisions at a set hour on dates published months ahead.
Before each release, economists publish forecasts; their average is the consensus. What moves the market is the surprise: how far the actual number lands from the consensus. A strong jobs report that everyone expected changes nothing, because it was already in the price.
Traders split into two camps:
- Follow the move. A big surprise takes time to digest, so get in after the first wave and ride the rest.
- Fade the move. The first reaction overshoots and the price drifts back. A related saying, "buy the rumour, sell the fact", claims the price runs ahead of the event and reverses once the news is out.
Starting the clock where you can actually trade
Our price history is hourly. US releases come at half past the hour (13:30 or 12:30 UTC, the world's reference clock, depending on the season), so the first price we can act on is the close of that hour, 30 minutes after the release. That first half hour is out of reach on purpose: professionals react in milliseconds, and a retail trader will not beat them. So the question is practical: from the first hourly close after the news, is anything left?
The study had three parts:
- US data surprises. 188 jobs reports and 188 CPI reports, 2011 to 2026, each with the consensus and the first published number (many websites show a later, revised figure, which the market didn't know on the day). Releases that matched the consensus exactly were left out.
- "Buy the rumour, sell the fact". The move in the 1 to 3 days before each jobs report, CPI release and US Federal Reserve meeting, and whether it reversed afterwards.
- Central banks. 1,056 scheduled rate decisions, 2010 to 2026, by the Fed, the European Central Bank, the Bank of England, the Bank of Japan, the Swiss National Bank (SNB), and the central banks of Canada, Australia and New Zealand.
Moves are in basis points (bp), hundredths of a percent. With EUR/USD near 1.10, one basis point is about 1.1 pips, the smallest usual price step. For US data we measured the dollar against an equal-weighted average of seven major currencies, so no single pair decides the result.
To keep ourselves honest, we split the history into up to 2020 and 2021 onwards: a pattern that works in only one half belongs to a period, not to the market. We also counted how many numbers we looked at, because slice results enough ways and some look good by luck (see our guide to backtesting without fooling yourself).
The first half hour does the work
The surprise matters, a lot. In the 30 minutes after a jobs report, the dollar moved the surprise's way in 71% of releases, where a coin would manage 50%, by 17.4 bp on average. Core CPI (inflation without food and energy) was almost identical: 70%, 17.9 bp. On the standard score for "more than luck" (0 means nothing, about 2 is what researchers call significant), these score 7.5 and 5.7. Not close calls.
Then the market stops caring.
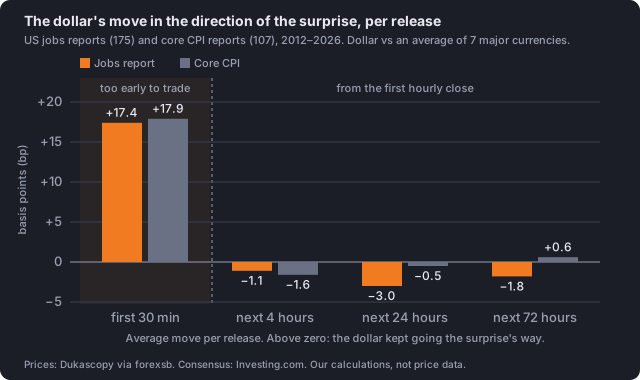
How to read it: each pair of bars is one time window after the release. The tall bars on the left are the first 30 minutes, which you can't trade. Everything to the right starts at the first hourly close. Above zero, the dollar kept going the surprise's way; below zero, it gave some back.
From the first close, the next 4, 24 and 72 hours all sit within a few basis points of zero. After jobs reports the dollar gave back 3 bp over the next day, a score of −1.0: nothing. Big surprises didn't change that, and whichever way the dollar first jumped, what came next was a coin flip.
Can you still collect after the first close?
The simplest possible trade: at the first hourly close after the release, buy or sell EUR/USD in the direction of the surprise and close 24 hours later. The cost is the spread, the gap between the buying and the selling price, which is how a retail broker gets paid: 0.8 or 1.5 pips per round trip.
| Release | Trades | Before costs | Trades that made money (a coin: 50%) | After a 1.5-pip spread |
|---|---|---|---|---|
| Jobs report | 175 | −3.5 bp | 45% | −4.8 bp |
| Core CPI | 107 | +6.7 bp | 55% | +5.4 bp |
| Both together | 282 | +0.4 bp | 49% | −0.9 bp |
Average per trade, EUR/USD, following the surprise from the first hourly close, held 24 hours.
The jobs report trade loses; both together lose a little. Only core CPI is positive, and its two halves disagree:
- 2012 to 2020: −5.9 bp a trade before costs. Back then, the move after a CPI surprise tended to reverse.
- 2021 onwards: +24.1 bp a trade, with a score of 2.3. In the years of high inflation, the move kept going.
That looks like a discovery until you count. Three releases, fifteen ways of slicing them and three holding times make more than 130 numbers. With that many, a score of about 3.5 is needed to stand out from luck, and no "keeps going" result came close. The 2021+ average also leans on a few days when bigger news dominated, such as the US tariff pause of April 2025 and the week Silicon Valley Bank collapsed. We file it under "the market changed", not "here is a trade".
Buy the rumour, sell the fact?
The second saying fared no better. We bet against the dollar's move of the 1 to 3 days before a jobs report, a CPI release or a Fed meeting, starting after the news.
- Over the whole sample there was no reversal after any of the three.
- The move before a jobs or CPI report didn't even predict the surprise: it pointed the right way in 45% to 58% of cases, against 50% for a coin. That is guessing.
- Since 2021 the jobs report shows some giving back, about 9 bp with a score of 2.2. Before 2021 the sign was the opposite. Same story as CPI: a period, not a rule.
Central banks: eight banks, one oddity
Rate decisions are the biggest scheduled events in currency markets: in the announcement hour, the average decision moved the currency by 17 bp (the euro) to 58.5 bp (the New Zealand dollar).
From the first hourly close after each announcement, we tried four rules, after a 2-pip spread: follow the first hour's move for 24 hours, bet against it, trade the surprise, and bet against the week before (held 5 days). For the "surprise" we had to guess what the market expected from that week's move in 2-year government bond yields. That proved a weak guess, so the rules that need no guess carry more weight.
None earned enough to count across the eight banks:
- Follow the first hour: +1.8 bp a trade after costs, a score of 0.9. The link between the first hour and the next 24 hours was 0.10 on a scale where 1 is perfect: worth about 2 bp.
- Bet against the first hour: −5.9 bp: the spread, plus a move slightly against you.
- Trade the surprise: −1.4 bp. Bet against the week before: +0.6 bp. Nothing.
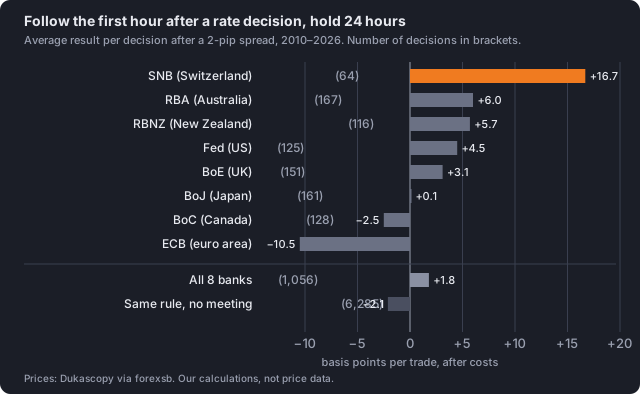
How to read it: each bar is the average result per decision, after costs. The bottom bar runs the same rule on weeks with no meeting, at the same hour, as a comparison. Most banks sit within a few basis points of zero. One doesn't.
The Swiss franc: a lead, not a rule
At the SNB, the first hour's direction tended to carry on. Following it for 24 hours averaged +16.7 bp a decision after costs over 64 quarterly decisions; 69% of those trades made money, against 53% for the same rule across all banks. It was positive in both halves (+10.1 bp before 2021, +28.3 bp since) and still there when entering an hour later. On weeks with no SNB meeting, the same rule lost 2.6 bp. There is even a plausible reason: the SNB announces at 9:30 Swiss time and holds a press conference at 10:00, inside the holding window.
Now the arithmetic. The central-bank part looked at about 460 numbers. By chance alone, about 21 should score above 2, and the bar for "more than luck" at that count is about 3.2. The SNB scores 3.1: just under the bar, on 64 decisions. It is the most interesting thing in the study and it still failed our own test, so we do not treat it as an edge. Four meetings a year is slow, but the only fair check is to write the rule down before each 2026 and 2027 meeting and see whether it keeps up.
So, is the move over in 30 minutes?
For US jobs and inflation reports, yes. The surprise is priced in the first half hour, and from the first hourly close the price is about as predictable as a coin. Seven of the eight central banks look the same, and the eighth is not proven. Both camps miss: there is no move left to follow or to fade, and the spread is the one cost you always pay.
What would change the picture
- Faster hands. The first 30 minutes are a different game, for traders with tick data and fast execution. Not a retail setup, and not one our hourly data can test.
- A better measure of expectations. Market-implied odds of a hike or cut, taken just before the meeting, would give the central-bank "surprise" test a fairer chance than bond yields did.
- More post-2021 data. CPI and the jobs report both behaved differently after 2021; only new data can show whether that lasts.
The fine print
- Small samples. About 12 releases a year per US report and about 8 meetings a year per bank. Per-bank results can't rule out effects of 10 to 20 bp either way.
- The first close isn't always 30 minutes. For the ECB it came 15 minutes after the decision; the Bank of Japan has no fixed time, so we used a morning window. Some New Zealand dates were rebuilt from secondary sources and checked against the price spikes they should cause.
- Spreads around a release can be wider than we assumed, which would only make things worse.
- No euro-area inflation. We found no reliable history of consensus forecasts for it.
Everything behind this article, including the method, the scripts and every event's measured move, is in the study files.
Educational content, not financial advice.